“IT organizations must understand the risks associated with their mission critical applications, from knowing the systems that production applications depend on to seeing the performance of new applications as they roll out” –Gartner.
For any organization there will be hundreds of applications being used by the end-users. At any point of time there is a huge amount of transactions happening among these applications. Some of these applications are very critical and failure of any single transaction can lead to the failure of the business process as a whole. So, to know if the transactions are in a healthy state, a constant monitoring is required. Application transaction monitoring keeps a status check of the existing application portfolio and throws an alert whenever there is an issue impacting the end-user productivity.
Nagios uses WebInject tool for application transaction monitoring. It offers real-time display of results and may also be used for monitoring the system response time. WebInject is a tool for automated testing of web applications and web services. It can be used to test individual system components that have HTTP interfaces like JSP, ASP, CGI, PHP, AJAX, Servlets, HTML Forms, XML/SOAP Web Services, REST, etc. and can be used as a test harness to create a suite of (HTTP level) automated functional, acceptance, and regression tests. A test harness allows you to run many test cases and collect/report your results.
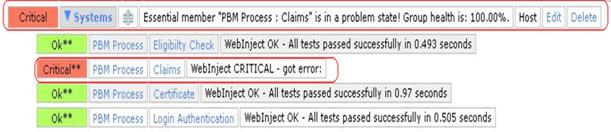
In the above fig. you can see how WebInject makes it very easy to find out the transaction flaw for a given business process. It shows the exact location of failure so that saves a lot of time in terms of resolving the issue.
WebInject can be used as a complete test framework that is controlled by the WebInject User Interface (GUI). Optionally, it can be used as a standalone test runner (text/console application) which can be integrated and called from other test frameworks or applications. WebInject is a test restrains that can operate as an intelligent test case agent that is able to chain together test cases to form a functional test suite for web application or web service.
Benefits of Nagios :
- Immediate alerts when the applications becomes slow or inoperable
- Root cause analysis of the failure like: port issue, URL content, DNS lookup, connection time, send time and authentication, etc.
- Ability of 24X7 reconfiguration when a transaction fails
- Customized notifications to end-users via email, SMS, Pager, etc.
- Continuous monitoring in terms of end user experience for each phase, whether it’s behind firewall, external or internally hosted web site
- Integrated view of the applications across platforms throughout IT infrastructure
Nagios provides the Application performance monitoring (APM) tools which facilitate customizing, end user experience monitoring, in depth troubleshooting capabilities, and provide much greater business value to the non-technical users.
- Application and 3rd party Integration:
Nagios provides a framework (or API) that can be used by external application to update the current status of the system or service that is getting monitored. Nagios is able to provide enough details for external vendors and 3rd party applications to integrate their solution with the monitoring software. The more extensible the framework is, more vendors will provide solution, and more the company can use it to make the software robust.
- Ease of Escalation:
Nagios provides the ability to notify managers, when the owner of the system is not taking action on an issue within certain time period (SLA). For example, when a Server crashes, and System Admin doesn’t fix it within reasonable time (SLA), the monitoring system will alert to (next level) the manager about the issue with various escalation channels like Mail, SMS, Pager and incident Management System.
- Customized Dashboards:
Customized Web Dashboard provides overall health, issues, and alerts for all the systems across the network, along with the ability to drill-down to individual hosts and services.
Conclusion
Every day the business applications are becoming more complex and it has been seen that even a smallest thing can send a business crashing. In fact, 74% of all application problems are reported to the IT department by the end-users (through the Service Desk). Clearly, the IT department needs a solution that can proactively see these problems and help solve them before the end-user is impacted. Application transaction monitoring proactively alerts with early detection of problems. It identifies transaction issues before they impact business service delivery. Down the line this goes on to reduce the time and efforts invested by the IT team; not to mention the cost savings.
- Make the most of your cloud experience with an AWS cloud managed service partner - February 7, 2023
- Top 10 AWS Cloud Managed Services to transform your business this year - January 25, 2023
- Top AWS DevOps tools to change your Cloud build and deployment game - October 12, 2022


Comments
IMHO and you missed out to mention that it(nagios) prone to false alerts too!! YMMV
Nagios helps to prevent such false alerts using max_check_attempts option which you can define how many times a service or host should be checked when actual issue occurs. I hope answered your question, let me know if something else..